Velocity in Doppler Radar
Velocity is another key element of Doppler radar and plays a crucial role in tracking storm movement and identifying severe weather conditions, especially tornadoes and high winds. Velocity measures the speed and direction of particles in the atmosphere, mainly focusing on the wind. This is critical for understanding storm rotation, movement, and wind shear.
The data is gathered through the Doppler effect, which describes how the frequency of a wave changes when an object moves toward or away from the radar. When raindrops or wind move toward the radar, the frequency increases (a shift toward higher frequencies). When they move away from the radar, the frequency decreases (a shift toward lower frequencies). By measuring these shifts, Doppler radar can detect the speed and direction of winds in a storm.
Velocity data is also color-coded:
Strong contrasts between green and red areas are especially important. These areas, known as velocity shear, can indicate rotating winds, which are often a sign of severe weather conditions like tornadoes. Meteorologists watch these changes closely to determine if a storm is likely to produce a tornado or if it poses a danger to surrounding areas. Velocity data is essential for forecasting wind patterns, tracking storm movement, and issuing alerts for dangerous weather events.
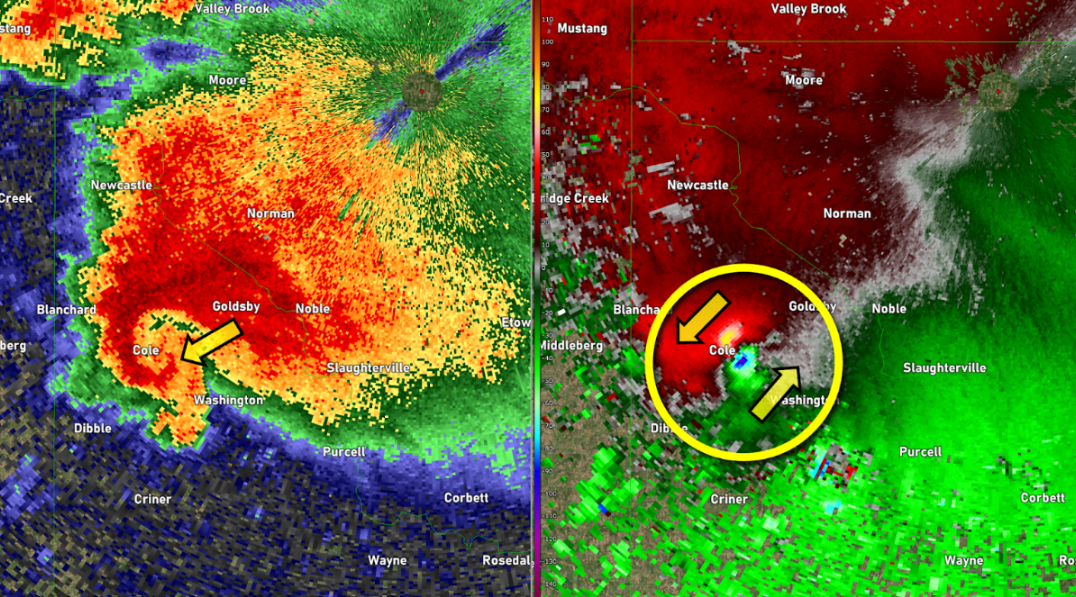
The image pair above shows a supercell thunderstorm, a storm capable of producing tornadoes. Meteorologists use both reflectivity and velocity data to track severe weather like tornadoes. In this case, the contrast between the inbound (green) and outbound (red/yellow) winds in the velocity image is called a “couplet.” This is a strong indicator of rotating winds, which can lead to tornado formation. While the radar doesn't directly detect a tornado, it detects the powerful rotation that often precedes one. This rotation is known as a tornado vortex signature (TVS). By using multiple radar scans from different angles, meteorologists can confirm if a tornado is indeed forming and issue warnings accordingly.